


Since 1957, there have been just three dual winners of the Coral Gold Cup at Newbury: Mandarin, Arkle and Denman. Denman came from Paul Nicholls’ yard, and Nicholls, who won this with both Denman and Kandoo Kid on their first run of the season, is bidding to repeat the feat with Regent’s Stroll.
Nine Cheltenham Gold Cup winners have also landed this race during their careers, but only Many Clouds has won both this and the Grand National.
All of that confirms it takes a good horse to win this, and often it takes a great one, so I’ve looked at the last 25 renewals and compared them with the last ten to see what it takes to land this contest.
KEY TRENDS
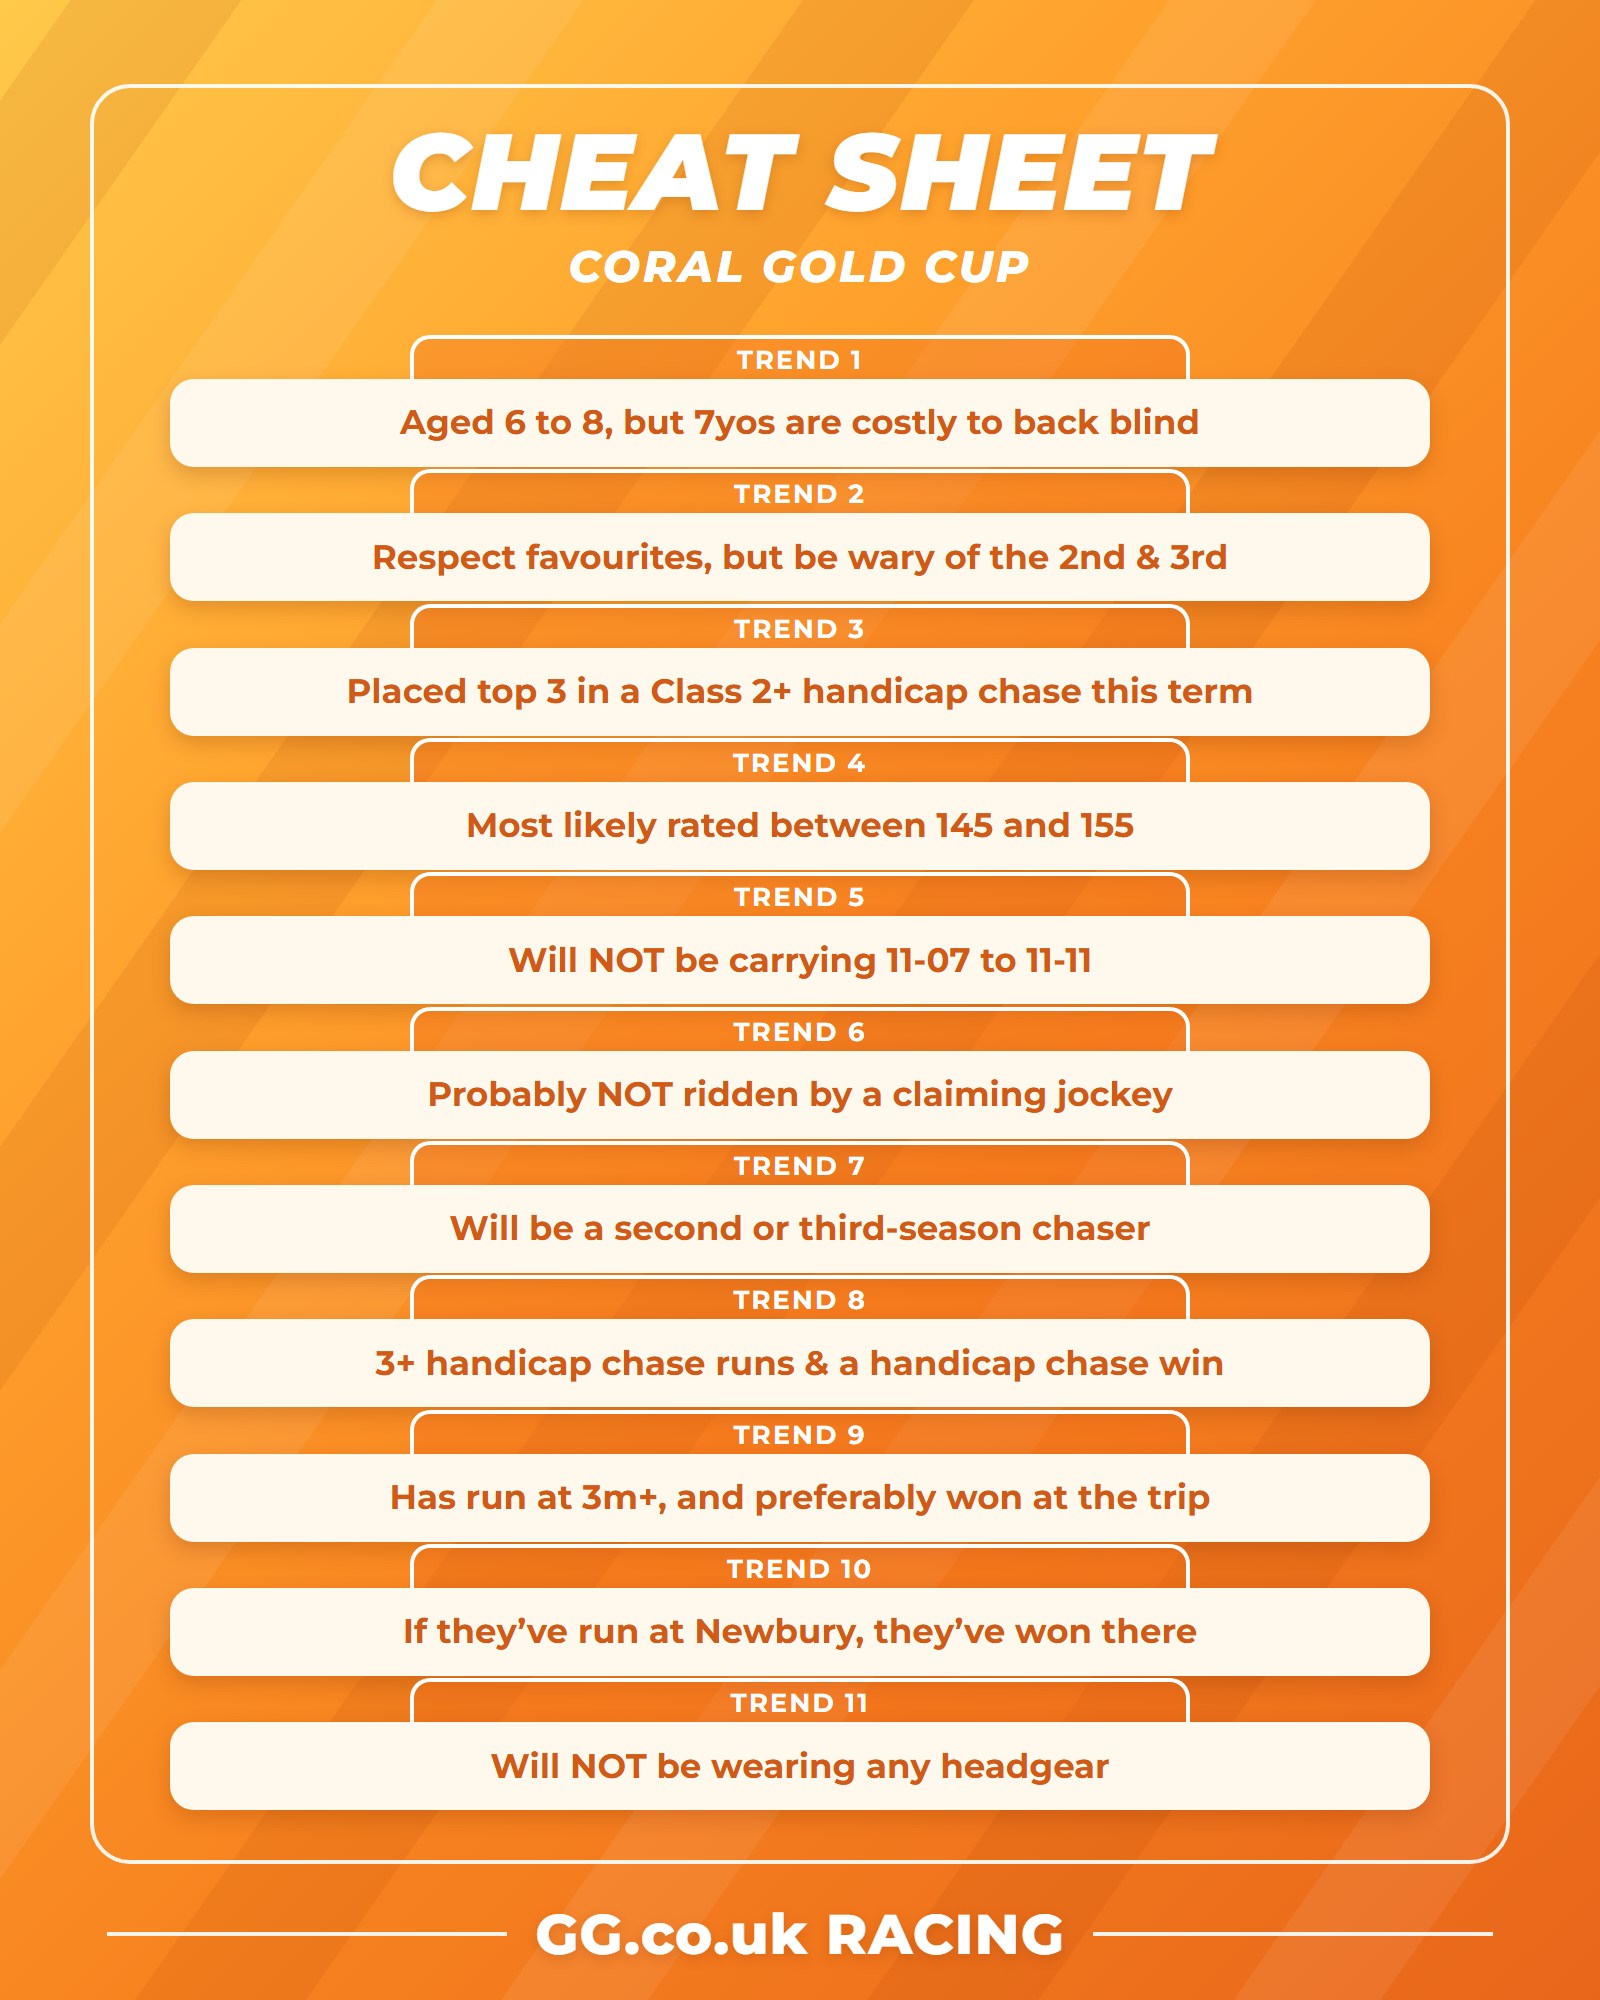
- Likely to be aged between 6 and 8, but 7yos are costly to back blind
- Respect favourites, but be cautious of second and third favourites
- Has run this season in a Class 2 or better handicap chase, placing in the top three
- Most likely to be rated between 145 and 155
- Will NOT be carrying 11-07 to 11-11
- Probably NOT ridden by a claiming jockey, but this trend could be turning
- Will be a second or third-season chaser
- Likely has three or more handicap chase runs and at least one handicap chase win
- Should have run at 3m or further, and preferably won at the trip too
- If a horse has run at Newbury, they should have won at Newbury, but the winner can be having their first look at the track
- Will NOT be wearing any headgear
Focused Trends
AGE
- 6yo – 5/25 (20%) & 1/10 (10%)
- 7yo – 10/25 (40%) & 3/10 (30%)
- 8yo – 7/25 (28%) & 4/10 (40%)
- 9yo – 2/25 (8%) & 1/10 (10%)
- 10yo – 1/25 (4%) & 1/10 (10%)
The strike-rates for the last 25 renewals sit at 9%, 6% and 7% for 6, 7 and 8yos respectively, while 9 and 10yos are much lower at 2% and 3%.
9yos are the heaviest loss-makers when backed blind, while 8yos show a loss of just 5% ROI over the last 25 renewals and a 15% ROI profit in the last ten.
7yos perform well in terms of the volume of winners, but they also account for the highest number of runners, making them loss-makers when backed blind, with a -50% ROI in the last decade alone.
POSITION IN THE MARKET
- Top seven in the betting – 19/25 (76%) & 7/10 (70%)
- Top three in the betting – 11/25 (44%) & 3/10 (30%)
- Favourite – 7/25 (28%) & 3/10 (30%)
Favourites are profitable to back blind across both periods, although second and third favourites are costly to follow. It’s not much further down the market rankings to find more winners, though, with around three-quarters of winners coming from the first seven in the betting.
LAST TIME OUT
- Finished first – 12/25 (48%) & 4/10 (40%)
- Finished in the top three – 19/25 (76%) & 7/10 (70%)
- Failed to complete – 3/25 (12%) & 1/10 (10%)
- Ran over fences – 23/25 (92%) & 8/10 (80%)
- Ran in a handicap – 14/25 (56%) & 9/10 (90%, all of the last nine)
- Ran at about 3m or further – 17/25 (68%) & 6/10 (60%)
- Ran within the last 60 days – 16/25 (64%) & 8/10 (80%)
- Prominent in the betting – 21/25 (84%) & 10/10 (100%)
- Ran in Class 2 or better – 25/25 (100%) & 10/10 (100%)
All of the last nine winners last ran in a handicap, and most winners across both periods finished in the top three last time out.
While nine winners have landed this on their first run of the season, it’s just two from the last 13, so more recent winners have had a prep run coming into this, and that’s come in a handicap over fences.
All winners ran in at least a Class 2 last time out, and every winner since 2009 was prominent in the betting on their previous start.
OFFICIAL RATING
- Between 145 and 155 – 17/25 (68%) & 8/10 (80%)
- Between 145 and 150 – 12/25 (48%) & 6/10 (60%)
There have been some high-rated winners of this race this century, but the rating window has come down slightly, with no winner rated above 155 since Bobs Worth in 2012.
The average official rating of the winners from 25 years ago up to Bobs Worth in 2012 was 151.25, and since then it’s 146.6.
WEIGHT CARRIED
- 11st 6lb or LESS – 22/25 (88%) & 10/10 (100%)
The three winners who carried more than 11-06 were all top weights, and almost 50 horses have raced carrying 11-07 to 11-11 without success.
JOCKEY
- Ridden by a non-claiming jockey – 23/25 (92%) & 8/10 (80%)
Experience counts for jockeys in big handicaps like this, although the two winning jockeys who were claiming weight have both come in the last seven renewals, including last year.
SEASONS OVER FENCES
- First season – 1/25 (4%) & 0/10 (0%)
- Second season – 14/25 (56%) & 6/10 (60%)
- Third season – 9/25 (36%) & 4/10 (40%)
- Fourth season – 1/25 (4%) & 0/10 (0%)
Across both periods, second-season chasers have landed the most renewals, with most of the others coming from third-season chasers.
CHASE FORM
- Two or fewer handicap chase RUNS – 12/25 (48%) & 1/10 (10%)
- One or more handicap chase WINS – 16/25 (64%) & 9/10 (90%, all of the last nine)
- Seven or more RUNS over fences – 15/25 (60%) & 8/10 (80%)
- Two or three WINS over fences – 18/25 (72%) & 8/10 (80%)
Previous handicap chase winners weren’t always the ones to side with, as ten of the first 17 winners this century had yet to land a handicap chase. However, all of the last nine winners had won a handicap chase, and all of them had at least three previous handicap chase runs.
This reflects a change in the sport, with more experience now required to feature in the bigger contests at this point of the year.
DISTANCE FORM
- Had RUN at about 3m or further – 24/25 (96%) & 9/10 (90%)
- Had WON at about 3m or further – 19/24 (79%) & 7/9 (78%)
Only the 2024 winner, Kandoo Kid, had NOT run at about 3m or further before winning this race, although the last three winners had NOT won at 3m or further beforehand. That aside, the trend is consistent across both periods, with just under 80% of winners having run and won over 3m-plus during their careers.
COURSE FORM
- Had RUN at Newbury – 16/25 (64%) & 5/10 (50%)
- Had WON at Newbury – 13/16 (81%) & 5/5 (100%)
The last 12 winners of this race who had run at Newbury had also won here, so it’s winning course form, not just course experience, that we’re looking for. We have seen plenty of winners having their first look at the track, though, so they must be considered too.
HEADGEAR
- Winners in first-time headgear – 2/25 (8%) & 1/10 (10%)
- Winners in headgear, not for the first time – 1/25 (4%) & 1/10 (10%)
Horses sporting headgear, whether for the first time or not, are unlikely winners of this race, with just three winners from 105 runners in the last 25 renewals.
It’s 22 winners from 352 runners without headgear, and 20 of those were prominent in the betting, but combining those two metrics would still only show a negative 3% ROI.
Commercial notice: This article on GG.co.uk contains affiliate links. The offers we promote come from operators that we trust and our experts have first-hand experience dealing with. If you open an account through one of these affiliate links then GG will earn revenue. However, we ensure that the money earned goes back into improving and enhancing our coverage of horse racing and other sports, as we look to provide an excellent service to our growing audience.